I’ve written previously about why the true mantra of real estate should be “jobs, jobs, jobs” instead of the old “location, location…”. The performance of every property type is dependent on the employment conditions in the local market. Here is an online tool showing county level jobs data in an interactive map.
 The image at left is a screenshot from the website. This is an interactive map showing job growth by industry at the county level. Go to the site, roll your cursor over the map and you will see the breakdown of job growth stats for the county. Click on the county and the table at bottom will give even greater detail.
I spent over an hour checking out my home markets, other markets I’ve targeted for expansion, and those where friends and colleagues live… but then I’m pretty much a data geek, which means give me a dataset I can manipulate and I’ll be entertained for hours! An advantage to looking at a composite of 5 years of data is that it smooths seasonal fluctuations, however it does have one major drawback. (more on that in a moment)
The NewGeography site also has an index for the 2018 Best Cities for Job Growth. (To sort the data, copy the chart into Excel and use the Data | Sort function.)
As to the drawback of the 5-year data, this has been the most turbulent 5 year period for employment changes since the 1980’s. So while I love the quick fix of information on an interactive tool, I will also go to the Bureau of Labor Standards site to get the most current data.
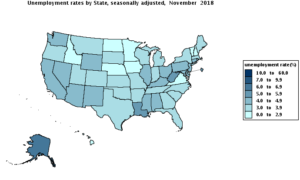
 This image from BLS depicts unemployment rate by county for the past 12 months. The raw data is available on the same page downloadable in an Excel spreadsheet. As you can see, there are some differences between the color coding of the two maps.
By the way, the BLS site has enough employment and labor market data to make your eyes bleed. While you’re there take the tour of the datasets. I get the data for any market I’m invested in on a quarterly basis to keep a weather eye on market conditions.
In choosing real estate markets to invest in there is no such thing as too much information about the local employment conditions. Jobs and HH income levels affect consumer spending in retail stores, demand for office space, rent growth and occupancy for apartments, and ultimately the tax base for the community. This determines the quality of schools, public services and overall quality of life. In sum, everything that is important to real estate values and performance.