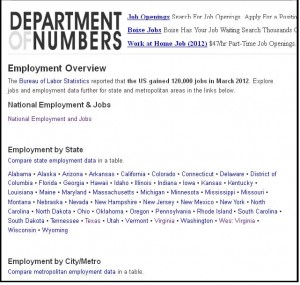
Drilling down into local market conditions for commercial real estate requires current (and accurate) statistics for employment, income and population characteristics. Half the battle is finding the data. In a follow-up to Monday’s post, Market Selection 101, here is another site with employment and unemployment data.
 The Department Of Numbers is a blog with data sets for national employment statistics derived from the monthly BLS reports. The data is organized by state and metro areas. The site also has data on household income by metro. This is another level of “granularity” as the biz speak gurus put it, also known as “details” to dirt merchants.
I was tipped to the site by a report from a local economic development organization I belong to, the New River Valley Economic Development Alliance
The director, Aric Bopp, sent the data for my hometown metro, Blacksburg VA. Aric was spreading the word that our corner of the world has been on a job creation roll the past year. During the calendar year of 2011, the Blacksburg/Christiansburg/Radford MSA (aka the New River Valley) ranked 3rd (out of 363 MSA’s) for “1 Year CES Jobs Percent Change”.
I love news like that, because on a percentage basis our little metro can compete with the big guys. (The nominal increase was 3,600 jobs. But you gotta admit, “3rd in the nation for percent job change” has a better spin!)
Combined with the county data available from the BLS site you can get a pretty good handle on local employment conditions for any given market. If your county is not part of an MSA (Metropolitan Statistical Area), contact your state or local economic development folks. They are usually sitting on a trove of data available for the asking.